Fund Summary
Hoya Capital Housing ETF (Ticker: HOMZ) offers diversified exposure across the entire United States residential housing industry, seeking to invest in many of the fastest-growing real estate companies.
HOMZ invests in 100 companies involved across the U.S. housing industry including rental operators, homebuilders, home improvement companies, and real estate services and technology firms. HOMZ expects to pay monthly distributions.¹
Investment Objective
HOMZ seeks to provide investment results that, before fees and expenses, correspond generally to the total return performance of the Hoya Capital Housing 100 Index ("HOMZ Index"), a rules-based Index designed to track the 100 companies that collectively represent the performance of the US Housing Industry.
The HOMZ Index is designed to track the companies across the entire U.S. housing industry, including those with the potential to benefit from rising rents, appreciating home values, and a persistent housing shortage.
 An Award-Winning Issuer
Hoya Capital is an award-winning ETF issuer, winning the Most Innovative & Successful ETF Launch of 2019 by ETF Express. Hoya Capital was also named one of five finalists for three awards by ETF.com including Best New US Equity ETF and was named one of five finalists by ETF.com for New ETF Issuer of the Year.¹
 Factsheet
 XBRL File
Why Invest in HOMZ?
Access the Growth & Income Potential of Real Estate

An Award-Winning ETF
HOMZ Was Named the Most Innovative & Successful ETF Launch of 2019 by ETF Express.¹
Growth & Income Potential
HOMZ provides the opportunity for capital appreciation and expects to pay monthly distributions.²
Access & Efficiency
Gain exposure to real estate with the all-day tradability, accessibility, and transparency of an ETF.
Portfolio Diversification
Diversified exposure to companies owning more than a million homes across the United States.³| FUND DATA & PRICING | |
|---|---|
| Net Assets as of 04/16/2024 | $38.93m |
| NAV | $40.98 |
| Shares Outstanding | 950,000 |
| Premium/discount Percentage | -0.08% |
| Closing Price | $40.95 |
| Median 30 Day Spread | 0.26% |
Data as of 04/16/2024
30-Day SEC Yield: A standard yield calculation developed by the Securities and Exchange Commission that allows for comparisons between funds. The yield figure reflects the dividends and interest earned during the period after the deduction of the fund's expenses. It is also referred to as the "standardized yield." It is calculated as of the most recent month end.
12-Month Trailing Yield: The distribution yield an investor would have received if they had held the fund over the last twelve months, assuming the most recent NAV. The 12-Month Trailing Yield is calculated by summing any income, capital gains, and return of capital distributions over the past twelve months and dividing by the sum of the most recent NAV and any capital gains made over the same period.
Distribution Yield: The annual yield an investor would receive if the most recent fund distribution remained the same going forward. The yield represents a single distribution from the fund and does not represent total return of the fund. The distribution yield is calculated by annualizing the most recent distributions and dividing by the most recent fund NAV.
30 Day Median Spread is a calculation of Fund’s median bid-ask spread, expressed as a percentage rounded to the nearest hundredth, computed by: identifying the Fund’s national best bid and national best offer as of the end of each 10 second interval during each trading day of the last 30 calendar days; dividing the difference between each such bid and offer by the midpoint of the national best bid and national best offer; and identifying the median of those values.
| MONTH END PERFORMANCE | Month end returns as of 3/31/2024 | ||||||
|---|---|---|---|---|---|---|---|
| AVG. ANNUALIZED | |||||||
| Month | Quarter | YTD | 1-Year | 3-Year | 5-Year | Since Inception | |
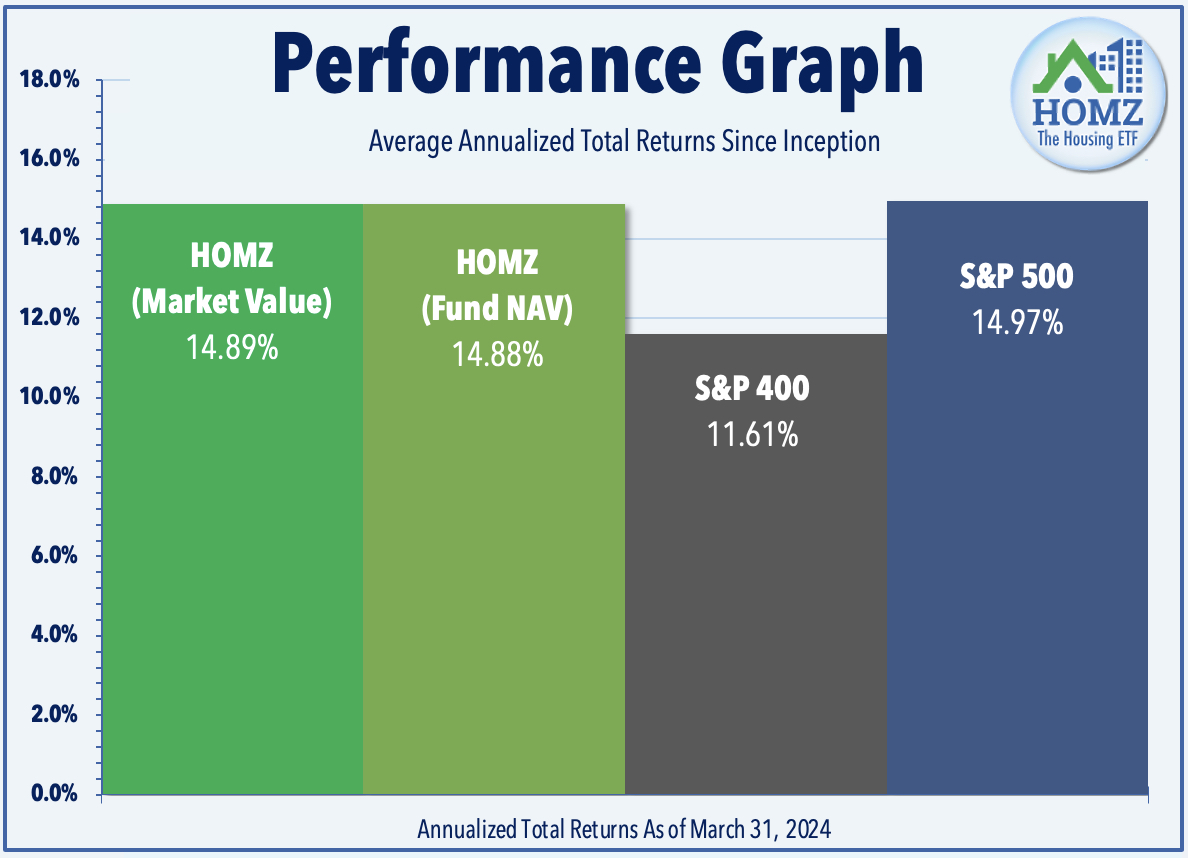
| HOMZ Market Value | 6.07% | 6.91% | 6.91% | 34.21% | 7.94% | 14.69% | 14.89% |
| HOMZ Fund NAV | 6.09% | 6.91% | 6.91% | 34.12% | 8.00% | 14.68% | 14.88% |
| S&P 400 Index | 5.60% | 9.95% | 9.95% | 23.33% | 6.96% | 11.71% | 11.61% |
| S&P 500 Index | 3.22% | 10.56% | 10.56% | 29.88% | 11.49% | 15.05% | 14.97% |
| QUARTER END PERFORMANCE | Quarter end returns as of 3/31/2024 | ||||||
|---|---|---|---|---|---|---|---|
| AVG. ANNUALIZED | |||||||
| Month | Quarter | YTD | 1-Year | 3-Year | 5-Year | Since Inception | |
| HOMZ Market Value | 6.07% | 6.91% | 6.91% | 34.21% | 7.94% | 14.69% | 14.89% |
| HOMZ Fund NAV | 6.09% | 6.91% | 6.91% | 34.12% | 8.00% | 14.68% | 14.88% |
| S&P 400 Index | 5.60% | 9.95% | 9.95% | 23.33% | 6.96% | 11.71% | 11.61% |
| S&P 500 Index | 3.22% | 10.56% | 10.56% | 29.88% | 11.49% | 15.05% | 14.97% |
Expense ratio: 0.30%
Inception Date: 3/19/2019
The performance data quoted represents past performance. Past performance does not guarantee future results. Returns for periods of less than one year are not annualized. The investment return and principal value of an investment will fluctuate so that an investor's shares, when sold or redeemed, may be worth more or less than their original cost and current performance may be lower or higher than the performance quoted. You cannot invest directly in an index.
ETF shares may be bought and sold in the secondary market at market prices and are not individually redeemed from the Fund. Brokerage commissions will reduce returns. Although it is expected that the market price of Shares will approximate the Fund's NAV, there may be times when the market price of Shares is more than the NAV intra-day (premium) or less than the NAV intra-day (discount) due to supply and demand of Shares or during periods of market volatility.
Short term performance, in particular, is not a good indication of the fund's future performance, and an investment should not be made based solely on returns.
The S&P 500 Index is a broad-based unmanaged index of approximately 500 large-capitalization stocks, which is widely recognized as representative of the U.S. equity market in general.
The S&P Mid-Cap 400 Index, also known as the S&P 400, is a broad-based unmanaged index of approximately 400 mid-capitalization stocks which is widely recognized as representative of the mid-cap segment of the U.S. equity market.
| TOP 10 HOLDINGS | Download Full Holdings | ||||
|---|---|---|---|---|---|
| Percentage Of Net Assets | Name | Identifier | CUSIP | Shares Held | Market Value |
| 3.08% | Lowe's Cos Inc | LOW | 548661107 | 5,225 | 1,195,793.50 |
| 2.91% | Home Depot Inc/The | HD | 437076102 | 3,388 | 1,127,628.04 |
| 1.91% | MDC Holdings Inc | MDC | 552676108 | 11,762 | 740,417.90 |
| 1.85% | Tricon Residential Inc | TCN | 89612W102 | 65,252 | 717,119.48 |
| 1.78% | Toll Brothers Inc | TOL | 889478103 | 6,088 | 690,500.96 |
| 1.71% | Apartment Income REIT Corp | AIRC | 03750L109 | 17,329 | 664,567.15 |
| 1.64% | NVR Inc | NVR | 62944T105 | 83 | 636,605.02 |
| 1.62% | PulteGroup Inc | PHM | 745867101 | 5,928 | 629,257.20 |
| 1.61% | Taylor Morrison Home Corp | TMHC | 87724P106 | 11,615 | 624,887.00 |
| 1.60% | Lennar Corp | LEN | 526057104 | 4,081 | 619,822.28 |
Data as of 04/18/2024. Subject to change without notice.
| DISTRIBUTION DETAIL | |||
|---|---|---|---|
| EX- Date | Record Date | Payable Date | Amount |
| 4/16/2019 | 4/17/19 | 4/18/19 | $0.06540 |
| 5/14/2019 | 5/15/19 | 5/16/19 | $0.01485 |
| 6/11/2019 | 6/12/19 | 6/13/19 | $0.03828 |
| 7/16/2019 | 7/17/19 | 7/18/19 | $0.07627 |
| 8/13/2019 | 8/14/19 | 8/15/19 | $0.02146 |
| 9/17/2019 | 9/18/19 | 9/19/19 | $0.05063 |
| 10/15/2019 | 10/16/19 | 10/17/19 | $0.06653 |
| 11/12/2019 | 11/13/19 | 11/14/19 | $0.01687 |
| 12/27/2019 | 12/30/19 | 12/31/19 | $0.07275 |
| 1/14/2020 | 1/15/20 | 1/16/20 | $0.02684 |
| 2/11/2020 | 2/12/20 | 2/13/20 | $0.00125 |
| 3/17/2020 | 3/18/20 | 3/19/20 | $0.02931 |
| 4/14/2020 | 4/15/20 | 4/16/20 | $0.06356 |
| 5/19/2020 | 5/20/20 | 5/21/20 | $0.03550 |
| 6/16/2020 | 6/17/20 | 6/18/20 | $0.02634 |
| 7/14/2020 | 7/15/20 | 7/16/20 | $0.05125 |
| 8/18/2020 | 8/19/20 | 8/20/20 | $0.03479 |
| 9/15/2020 | 9/16/20 | 9/17/20 | $0.02114 |
| 10/20/2020 | 10/21/20 | 10/22/20 | $0.07550 |
| 11/17/2020 | 11/18/20 | 11/19/20 | $0.13288 |
| 12/24/2020 | 12/28/20 | 12/29/20 | $0.52880 |
| 1/20/2021 | 1/21/2021 | 1/22/2021 | $0.02000 |
| 2/17/2021 | 2/18/2021 | 2/19/2021 | $0.00030 |
| 3/16/2021 | 3/17/2021 | 3/18/2021 | $0.03433 |
| 4/13/2021 | 4/14/2021 | 4/15/2021 | $0.07617 |
| 5/18/2021 | 5/19/2021 | 5/20/2021 | $0.04485 |
| 6/15/2021 | 6/16/2021 | 6/17/2021 | $0.03208 |
| 7/13/2021 | 7/14/2021 | 7/15/2021 | $0.08162 |
| 8/17/2021 | 8/18/2021 | 8/19/2021 | $0.03560 |
| 9/14/2021 | 9/15/2021 | 9/16/2021 | $0.03627 |
| 10/19/2021 | 10/20/2021 | 10/21/2021 | $0.11548 |
| 11/16/2021 | 11/17/2021 | 11/18/2021 | $0.03598 |
| 12/14/2021 | 12/15/2021 | 12/16/2021 | $0.02229 |
| 1/19/2022 | 1/20/2022 | 1/21/2022 | $0.02000 |
| 2/15/2022 | 2/16/2022 | 2/17/2022 | $0.02000 |
| 3/15/2022 | 3/16/2022 | 3/17/2022 | $0.04137 |
| 4/19/2022 | 4/20/2022 | 4/21/2022 | $0.10965 |
| 5/17/2022 | 5/18/2022 | 5/19/2022 | $0.03635 |
| 6/22/2022 | 6/23/2022 | 6/24/2022 | $0.05781 |
| 7/19/2022 | 7/20/2022 | 7/21/2022 | $0.0600 |
| 8/16/2022 | 8/17/2022 | 8/18/2022 | $0.0600 |
| 9/20/2022 | 9/21/2022 | 9/22/2022 | $0.0600 |
| 10/18/2022 | 10/19/2022 | 10/20/2022 | $0.0600 |
| 11/15/2022 | 11/16/2022 | 11/17/2022 | $0.0600 |
| 12/13/2022 | 12/14/2022 | 12/15/2022 | $0.0600 |
| 1/18/2023 | 1/19/2023 | 1/20/2023 | $0.0675 |
| 2/14/2023 | 2/15/2023 | 2/16/2023 | $0.0675 |
| 3/14/2023 | 3/15/2023 | 3/16/2023 | $0.0675 |
| 4/18/2023 | 4/19/2023 | 4/20/2023 | $0.0675 |
| 5/16/2023 | 5/17/2023 | 5/18/2023 | $0.0675 |
| 6/13/2023 | 6/14/2023 | 6/15/2023 | $0.0675 |
| 7/18/2023 | 7/19/2023 | 7/20/2023 | $0.0675 |
| 8/15/2023 | 8/16/2023 | 8/17/2023 | $0.0675 |
| 9/12/2023 | 9/13/2023 | 9/14/2023 | $0.0675 |
| 10/17/2023 | 10/18/2023 | 10/19/2023 | $0.0675 |
| 11/14/2023 | 11/15/2023 | 11/16/2023 | $0.0675 |
| 12/12/2023 | 12/13/2023 | 12/14/2023 | $0.0675 |
| 12/27/2023* | 12/28/2023* | 12/29/2023* | $0.06898* |
| 1/17/2024 | 1/18/2024 | 1/19/2024 | $0.0750 |
| 2/13/2024 | 2/14/2024 | 2/15/2024 | $0.0750 |
| 3/12/2024 | 3/13/2024 | 3/14/2024 | $0.0750 |
| 4/16/2024 | 4/17/2024 | 4/18/2024 | $0.0750 |
| 5/14/2024 | 5/15/2024 | 5/16/2024 | TBD |
| 6/11/2024 | 6/11/2024 | 6/12/2024 | TBD |
| 7/16/2024 | 7/16/2024 | 7/17/2024 | TBD |
| 8/13/2024 | 8/13/2024 | 8/14/2024 | TBD |
| 9/17/2024 | 9/17/2024 | 9/18/2024 | TBD |
| 10/15/2024 | 10/15/2024 | 10/16/2024 | TBD |
| 11/12/2024 | 11/12/2024 | 11/13/2024 | TBD |
| 12/17/2024 | 12/17/2024 | 12/18/2024 | TBD |
*Year-End Special Excise Distribution
Supplemental Tax Information
Hoya Capital Housing ETF Form 8937 - 2021